
Date.
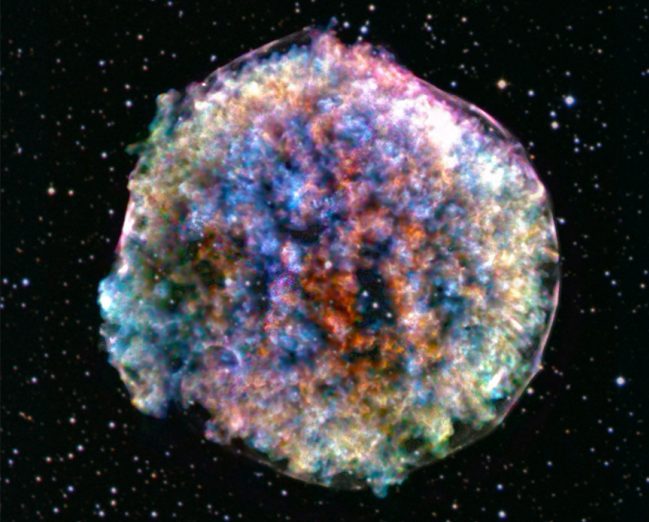
Figure: X-ray image taken with the Chandra space telescope of SN 1572 also know as the Tycho supernova remnant. The fluffy structures seen in the center represent the ejected layers of the exploded star made of heavy elements such as Si, S, Ar, Ca and Fe.
From the calcium in our bones to the iron in our blood, and oxygen we breathe, are largely the result of stellar processes, particularly supernovae. In the well known sentence “we are all made of stars”, we acknowledge our cosmic heritage and the role of these stellar explosions in making life possible.
We are all made of stars
Supernovae are among the most powerful and luminous explosion in the Universe, marking the final stages of stellar evolution. They play a key role in the galactic ecosystem by injecting kinetic energy, turbulence, energetic particles and heavy elements in the interstellar medium. These physical processes can be probed in the X-ray band via the thermal and non-thermal emission in the remnant of the supernova (SNR) for centuries after the explosion. For example, the ejected material (ejecta) produced during the explosion is heated to 10 millions K temperature by the fast shock waves (~5000 km/s) produced in the aftermath of the explosion.
This hot plasma enriched in heavy elements produced during the explosion produces bright X-ray emission. Thanks to the high sensitivity and spectral resolution of the X-IFU, the nucleosynthesis yield can be probed by measuring the abundances of the ejecta, in particular of rare elements (Cr, Mn). In young SNRs this provides unique insights into the mechanisms leading to the explosion of the star. In addition, by measuring the Doppler shifts of the emission lines, the velocity along the line of sight can be precisely estimated over the large number of spatial pixels of the X-IFU. The spatial distribution of this velocity information can then be used to obtain a 3d representation of how the star exploded which can be compared to numerical simulations.
A paradigm shift in the X-ray data analysis
The X-IFU instrument will provide datasets with an unprecedented level of details which will transform the way we understand the universe. However, in order to harness the full power of such instrument, X-ray astronomers will also need to transform the way they visualize and analyze X-ray data.
For the visualization aspect, we will need to consider the datasets not only as 2d images from one side and 1d spectral information on the other side but as a 3d (spatial + spectral) dataset as shown in the visualization in Figure 1 highlighting the fine level of spatial and spectral details that will be obtained. As shown in Figure 2, even in a small energy range many ionization states of a given element will be detected allowing precise measurements of the properties of the plasma.

Figure 1: A simulated 3d (RA, Dec, Energy) view of the Kepler supernova remnant as seen by the X-IFU instrument. The colors indicate the density of counts per voxels. The apparent “ring” structures are energy slices associated with bright emission lines.
Figure 2: The same Kepler SNR simulation is now shown zoomed in the 1.5-2.5 keV energy band to highlight Silicon and Sulfur line complex. The iso volume contours indicate the density of counts per voxels.
The analysis of such rich datasets challenges our current analysis tools. In the simple case of 1d spectral model fitting, the increasing complexity of the high-resolution spectroscopic data highlights the limitations of the traditional fitting tools. Leveraging on the extensive developments in the field of machine learning, new fitting methods are being explored for high-resolution X-ray spectroscopy. Recent examples have investigated Bayesian inference algorithms using modern CPU/GPU computing frameworks (e.g. jaxspec in Dupourqué et al., 2024) or simulation based inference approach using neural networks to directly retrieve the posterior distribution of the fitted model (Barret et al., 2024).
X-IFU will be the most advanced X-ray spectro-imager with the unique ability to map the spectral properties of the hot plasma in extended sources such as supernova remnants or clusters of galaxies. However, present methods are not taking the full advantage of the 3d information available in X-IFU data as they perform the spectral mapping by analyzing the spectrum of one region after another without using any spatial information. Here as well, a new generation of hypercube fitting methods are being developed such as the SUSHI (Lascar et al., 2024) algorithm which performs a spectral fitting of the entire data cube at once (instead of region by region) taking into account the spatial information. This enables to map the physical parameters at pixel scales (arcsec) without the need of a spatial rebinning.
By Fabio Acero
XSAT Member & Astrophysicist at the AIM laboratory (CEA/Saclay)
Credit: X-ray: NASA/CXC/SAO; Optical: DSS; Image Processing: NASA/CXC/SAO/N. Wolk
![]()
 LinkedIn
 X (ex-Twitter)
 Youtube